
Data should lead to action, not confusion. Zoho Analytics is a powerful business intelligence (BI) platform that allows you to create rich, interactive dashboards connected to Zoho CRM, Zoho Books, Zoho Desk, and third-party applications.
By consolidating key performance indicators (KPIs) into a single view, you empower your team to make faster, data-driven decisions that directly impact revenue growth.
Why Zoho Analytics Dashboards Matter for Decision-Making?
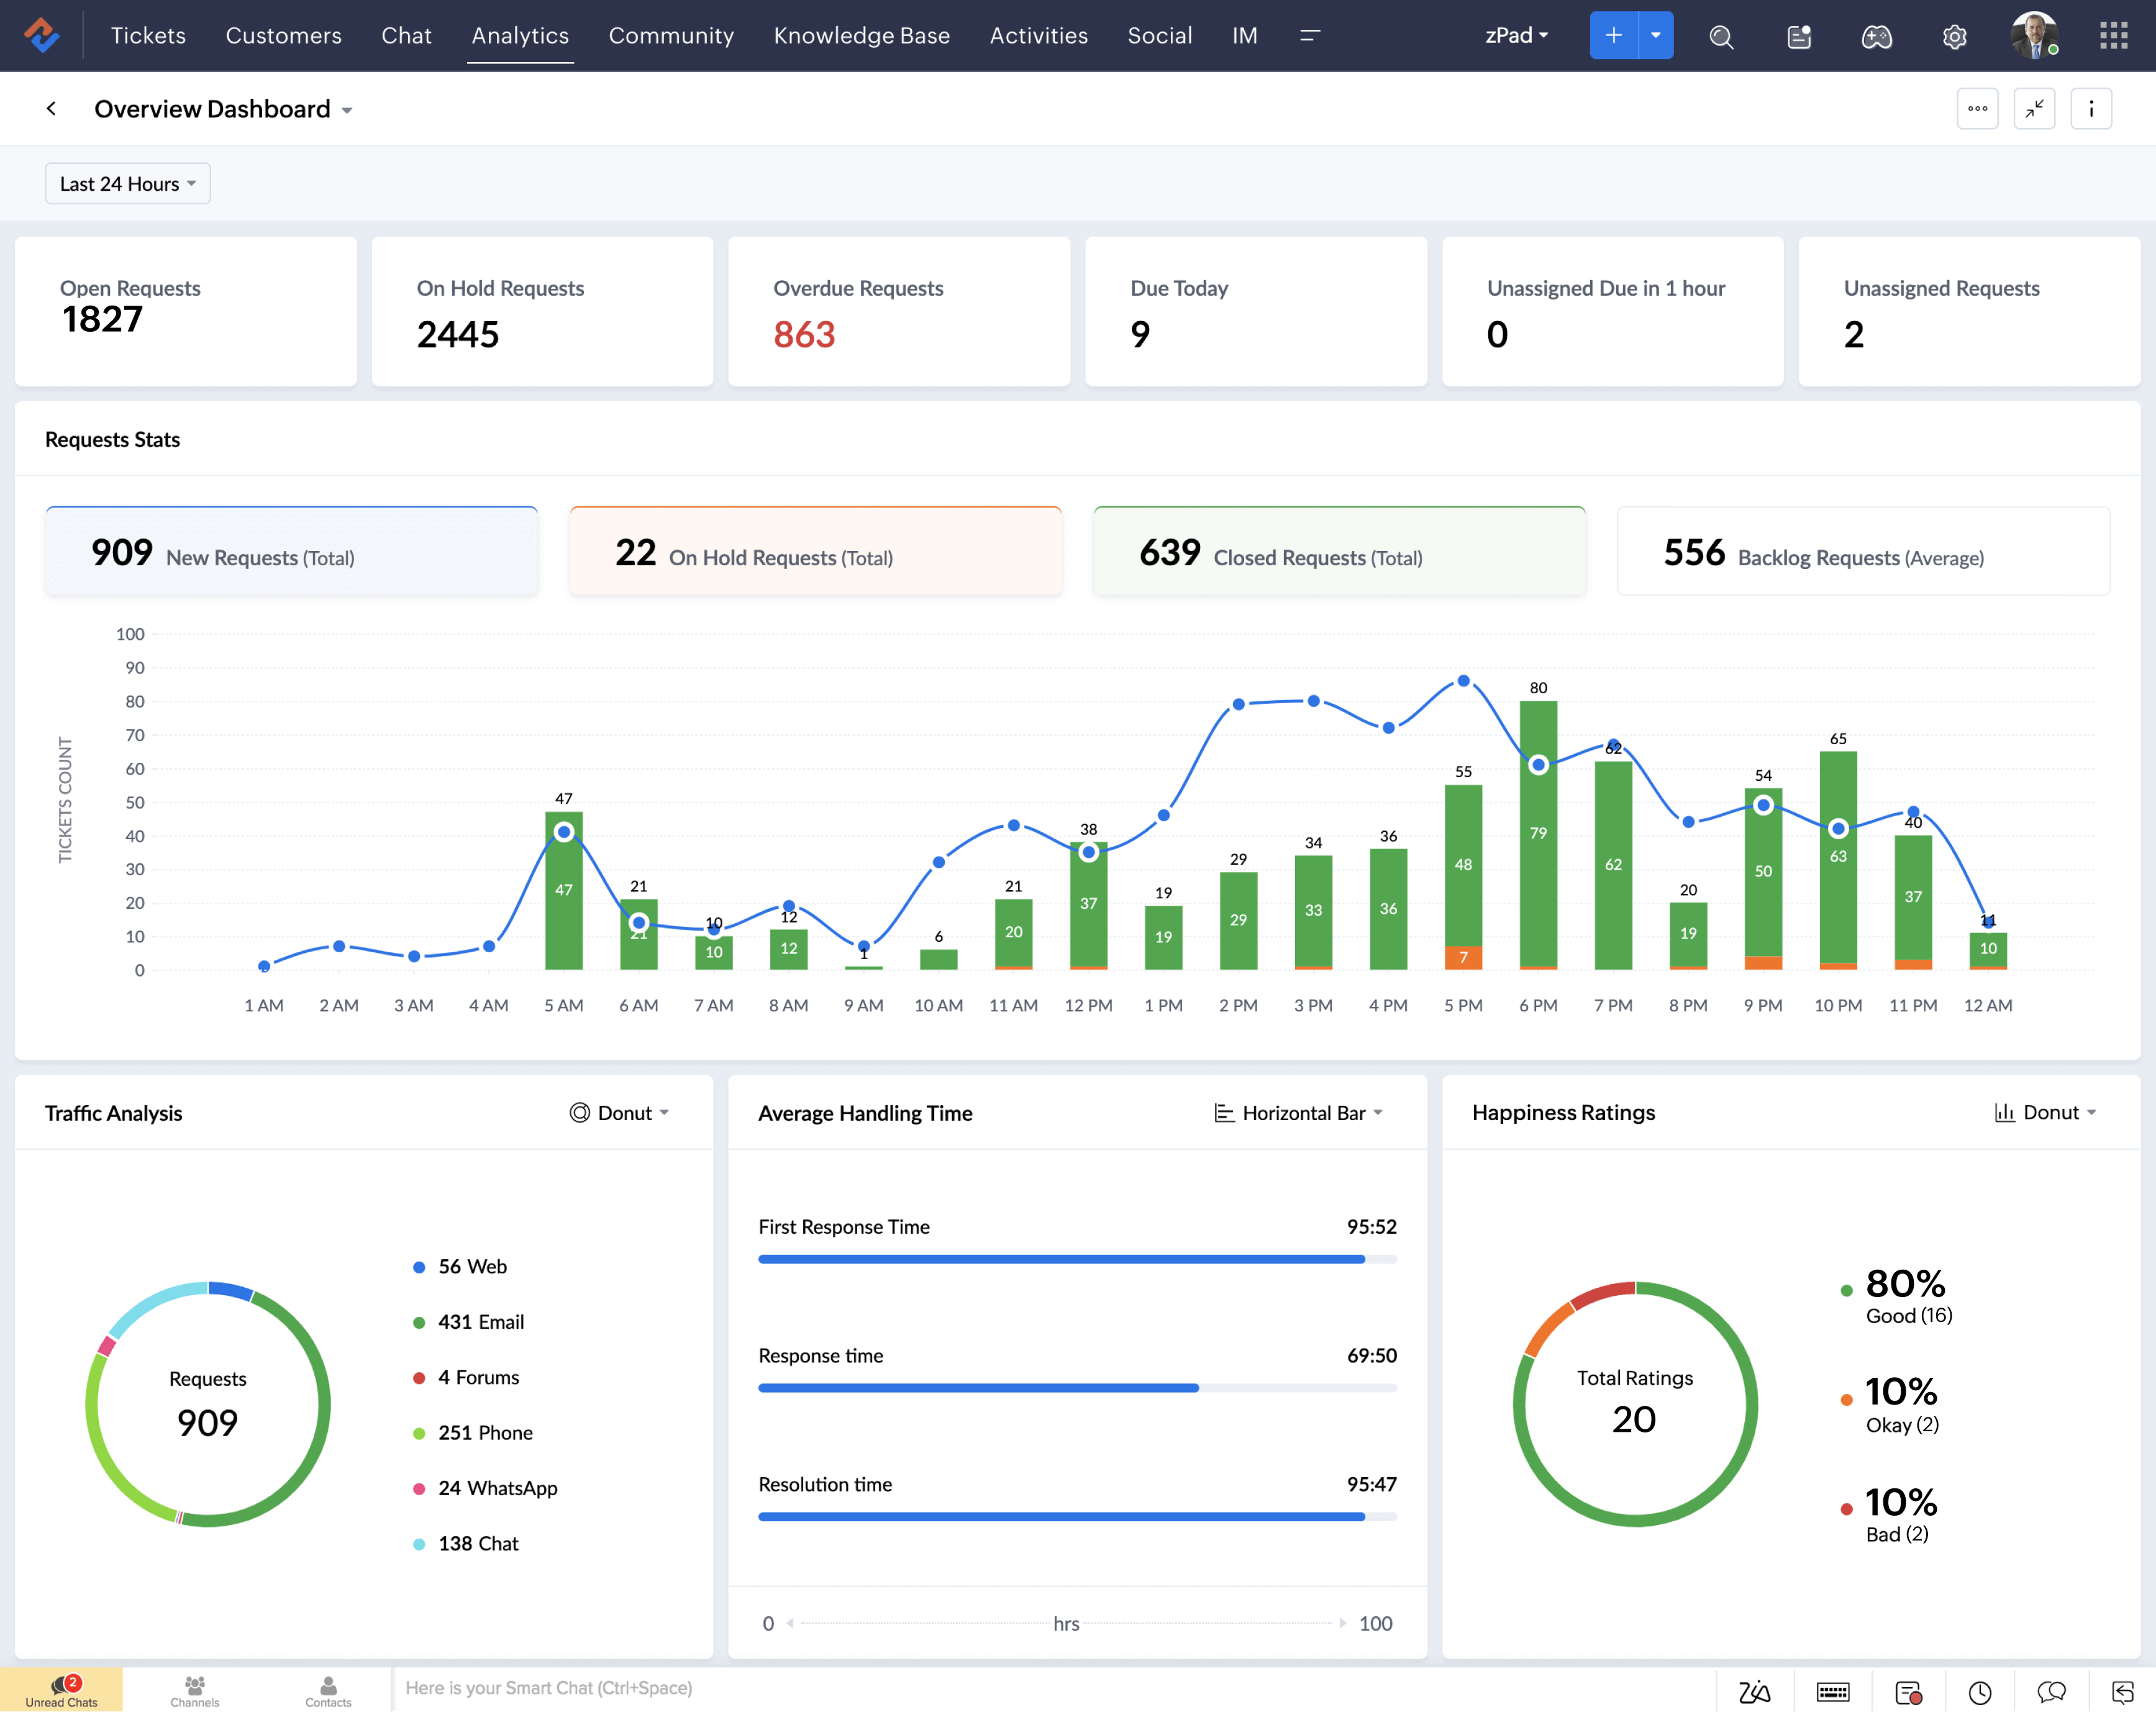
A well-designed dashboard turns raw data into actionable insights. Without a central view, sales teams, marketers, and executives often waste time switching between reports or exporting data into spreadsheets. Zoho Analytics dashboards unify all your essential metrics in one place, ensuring everyone works from the same, up-to-date information. This leads to better prioritization, quicker decisions, and more effective strategies.
Essential Dashboards to Build in Zoho Analytics
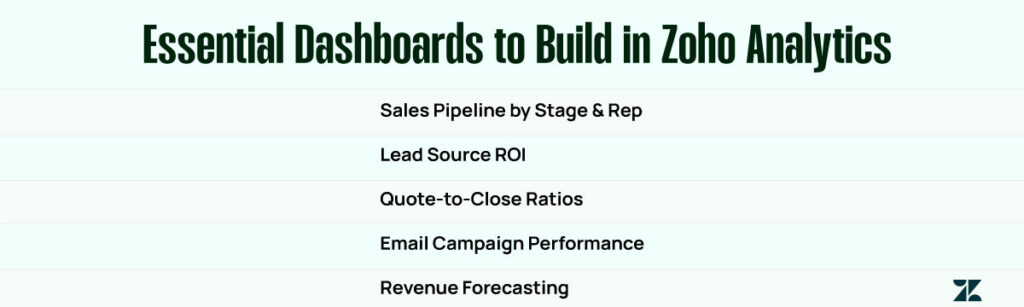
Sales Pipeline by Stage & Rep: Track opportunities by sales stage and owner to see where deals are stalling and identify top performers.

Lead Source ROI: Analyze which marketing channels generate the most valuable leads and allocate budget accordingly.
Quote-to-Close Ratios: Measure the percentage of proposals that convert into closed deals, helping refine your sales process.
Email Campaign Performance: Monitor open rates, click-through rates, and conversions from your email marketing efforts, synced directly from Zoho Campaigns.
Revenue Forecasting by Month or Product Line: Predict future sales based on historical trends, broken down by time or product category.
Integrate Data Sources for Comprehensive Insights
With Zoho Analytics, you can easily pull data from Zoho CRM, Zoho Books, Zoho Desk, and external systems, including Google Analytics, QuickBooks, Shopify, and HubSpot. Using data blending, you can combine information from multiple sources to gain a comprehensive view, for example, by linking marketing spend from Google Ads with closed revenue from Zoho CRM.
Choose the Right Visualizations
Zoho Analytics offers a variety of visualization formats, including bar charts, line graphs, cross-tab tables, heat maps, and geo maps. Choosing the correct format for your data makes trends easier to spot and helps stakeholders quickly interpret results.
Don’t overload your dashboard with every metric. Focus on the KPIs that directly influence decisions. Group metrics by department sales, marketing, and finance, and set up role-based access so each team sees what’s most relevant to them.